Appearance
Contents
Class distribution bar chart
Description and analysis
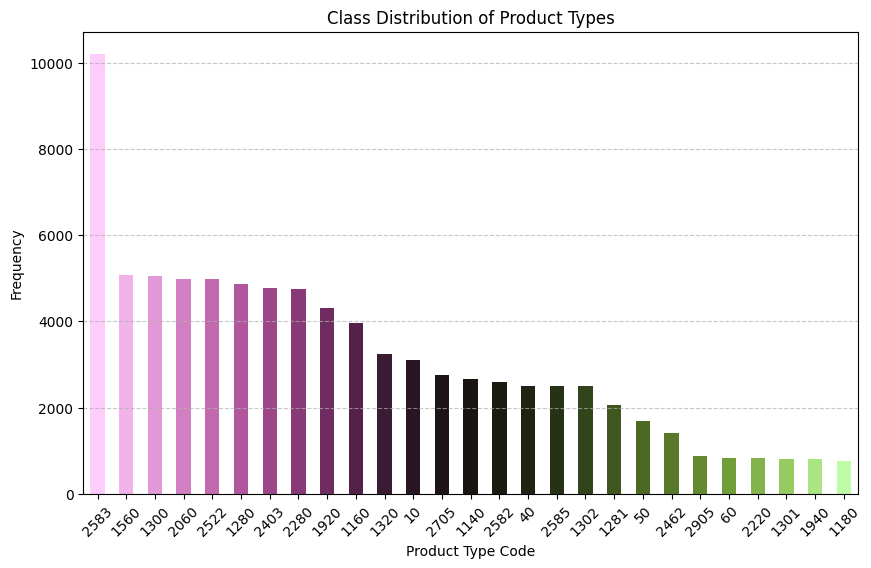
The bar chart displays the distribution of product types (prdtypecode) within the dataset. Each bar represents the frequency of a specific product type. There are 27 classes with a significant class imbalance.
| Product Type Code | Percentage |
|---|---|
| 2583 | 12.02% |
| 1560 | 5.97% |
| 1300 | 5.94% |
| 2060 | 5.88% |
| 2522 | 5.88% |
| 1280 | 5.74% |
| 2403 | 5.62% |
| 2280 | 5.61% |
| 1920 | 5.07% |
| 1160 | 4.66% |
| 1320 | 3.82% |
| 10 | 3.67% |
| 2705 | 3.25% |
| 1140 | 3.15% |
| 2582 | 3.05% |
| 40 | 2.95% |
| 2585 | 2.94% |
| 1302 | 2.93% |
| 1281 | 2.44% |
| 50 | 1.98% |
| 2462 | 1.67% |
| 2905 | 1.03% |
| 60 | 0.98% |
| 2220 | 0.97% |
| 1301 | 0.95% |
| 1940 | 0.95% |
| 1180 | 0.90% |
The product type code 2583 has the highest proportion at approximately 12%, indicating it is the most frequent product type in the dataset.
Several product types, such as 1560, 1300, 2060, and 2522, have similar proportions around 5-6%.
There are product types with notably lower proportions, such as 2905, 60, 2220, and others, each below 1%.
Validation
A chi-square test reveals a significant deviation from a uniform distribution in product types and thus a class imbalance.
Chi-square statistic: 36570.33
p-value: 0.0
INFO
A p-value of 0 may also be due to the very large sample size of X_train, so that the deviation is not as strong as implied by the values of the chi-square test.
Business relevance
Product types with higher frequencies may indicate strong market demand or a broader product range offered by the business. This can guide inventory management and marketing strategies.
Less frequent product types might represent niche markets or emerging trends. The business could explore expanding offerings in these areas to capture new market segments.
Class imbalance could pose risks in predictive modeling, potentially leading to inaccurate forecasts and thus errors in sourcing/purchasing.