Appearance
Contents
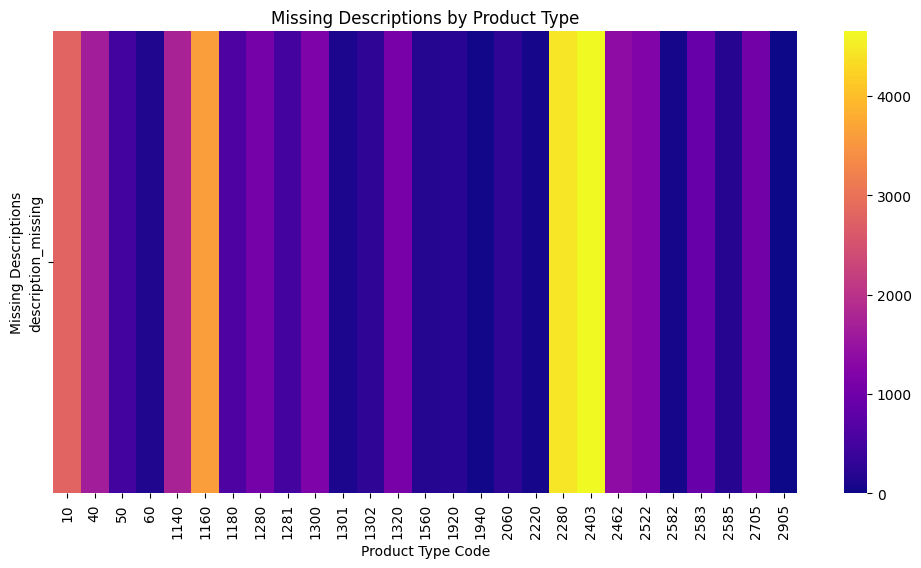
Heatmap of missing descriptions
Description and analysis
The heatmap displays the correlation between product type and missing values for variable 'description'. 'Description' is the only variable with missing values in the training and test set.
It is clearly visible that product types 2403 and 2462 have the most missing values for that variable, with more than 97% and 06% of missing values respectively.
| Product Type Code | Missing Description Percentage |
|---|---|
| 2403 | 97.36 |
| 2462 | 96.27 |
| 2280 | 93.28 |
| 1160 | 91.17 |
| 10 | 89.15 |
| 1180 | 79.97 |
| 40 | 65.47 |
| 1140 | 64.62 |
| 2705 | 37.12 |
| 1320 | 33.97 |
| 50 | 28.32 |
| 2522 | 23.83 |
| 1281 | 23.77 |
| 1300 | 23.25 |
| 1280 | 21.93 |
| 60 | 15.99 |
| 1301 | 13.01 |
| 1302 | 11.12 |
| 2583 | 8.85 |
| 2220 | 8.01 |
| 2585 | 7.93 |
| 2060 | 5.73 |
| 1940 | 5.60 |
| 1920 | 4.81 |
| 1560 | 3.49 |
| 2582 | 2.39 |
| 2905 | 0.00 |
Validation
A chi-square test reveals a significant deviation from a uniform distribution in missing descriptions per product type, indicating that the missing descriptions are indeed not evenly distributed across all product types. The missing value of the 'description' variable may even in itself be a useful feature for predicting the target variable.
Chi-square statistic: 40627.95
p-value: 0.0
INFO
A p-value of 0 may also be due to the very large sample size of X_train, so that the deviation is not as strong as implied by the values of the chi-square test.
Business relevance
Product types with higher percentages of missing descriptions may indicate areas where product information is lacking. This may hinder customer decision-making and affect SEO performance for Rakuten e-commerce. Addressing these gaps can enhance product visibility and improve customer satisfaction.
Conversely, product types with lower percentages of missing descriptions suggest better documentation and information availability, which can be leveraged in marketing strategies to highlight well-documented products.