Appearance
Contents
Convolutional Neural Networks (Images)
Initial modeling for images was performed using three different CNN architectures. All evaluations below use the preprocessed image datasets split into split_train and split_val directories, with images organized in class folders. Images are grayscaled and resized but not flattened to preserve spatial information for the CNN models.
CNN Model 1
The first CNN architecture serves as an initial baseline for image classification. It uses a simple convolutional architecture with three convolutional layers followed by a single dense layer.
Training Configuration
Optimizer: Adam with default learning rate Loss Function: Sparse Categorical Crossentropy Callbacks:
- Early Stopping (patience=3)
- ReduceLROnPlateau (factor=0.5, patience=2)
- ModelCheckpoint (save best model)
Training and Validation Accuracy Plot
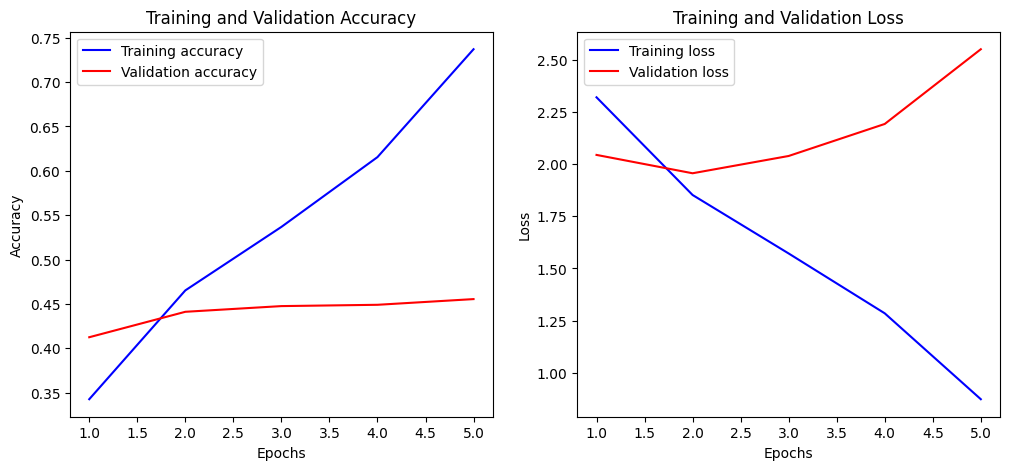
The plots show that the model's training accuracy improves steadily over five epochs, while validation accuracy increases only slightly before leveling off.
At the same time, training loss decreases consistently, but validation loss begins to rise after the second epoch. This indicates that the model is overfitting.
Classification Report
| Class | Precision | Recall | F1-score | Support |
|---|---|---|---|---|
| 0 | 0.5780 | 0.4118 | 0.4809 | 612 |
| 1 | 0.3357 | 0.4416 | 0.3814 | 539 |
| 2 | 0.8252 | 0.7926 | 0.8086 | 786 |
| 3 | 0.5000 | 0.0342 | 0.0641 | 146 |
| 4 | 0.1966 | 0.3143 | 0.2419 | 961 |
| 5 | 0.1839 | 0.1344 | 0.1553 | 424 |
| 6 | 0.3598 | 0.5031 | 0.4195 | 974 |
| 7 | 0.2857 | 0.1302 | 0.1789 | 169 |
| 8 | 0.2198 | 0.0789 | 0.1161 | 507 |
| 9 | 0.4450 | 0.1443 | 0.2180 | 672 |
| 10 | 0.4114 | 0.3139 | 0.3561 | 1013 |
| 11 | 0.5679 | 0.7015 | 0.6277 | 841 |
| 12 | 0.2202 | 0.1752 | 0.1951 | 137 |
| 13 | 0.2648 | 0.4305 | 0.3279 | 1029 |
| 14 | 0.6667 | 0.0118 | 0.0231 | 170 |
| 15 | 0.6440 | 0.6242 | 0.6340 | 942 |
| 16 | 0.3779 | 0.5852 | 0.4592 | 986 |
| 17 | 0.2451 | 0.2059 | 0.2238 | 306 |
| 18 | 0.4738 | 0.4844 | 0.4790 | 991 |
| 19 | 0.3089 | 0.1645 | 0.2147 | 462 |
| 20 | 0.6669 | 0.5809 | 0.6209 | 2047 |
| 21 | 0.2810 | 0.1467 | 0.1927 | 525 |
| 22 | 0.6415 | 0.8375 | 0.7265 | 517 |
| 23 | 0.8827 | 0.9153 | 0.8987 | 189 |
| 24 | 0.4263 | 0.5106 | 0.4646 | 521 |
| 25 | 0.2308 | 0.1261 | 0.1630 | 357 |
| 26 | 0.2472 | 0.1366 | 0.1760 | 161 |
| Metric | Value |
|---|---|
| Accuracy | 0.4411 |
| Macro avg Precision | 0.4254 |
| Macro avg Recall | 0.3680 |
| Macro avg F1-score | 0.3647 |
| Weighted avg Precision | 0.4513 |
| Weighted avg Recall | 0.4411 |
| Weighted avg F1-score | 0.4288 |
CNN Model 2
The second CNN architecture builds upon the first model with improvements to the network structure:
- Double convolutional layers in each block
- Batch normalization after each convolutional layer
- Dropout layers to reduce overfitting
- Increased capacity in the dense layer (256 vs 128 neurons)
- 'same' padding to preserve spatial dimensions
Training Configuration
Optimizer: Adam with default learning rate Loss Function: Sparse Categorical Crossentropy Callbacks:
- Early Stopping (patience=3)
- ReduceLROnPlateau (factor=0.5, patience=2)
- ModelCheckpoint (save best model)
Training and Validation Accuracy Plot
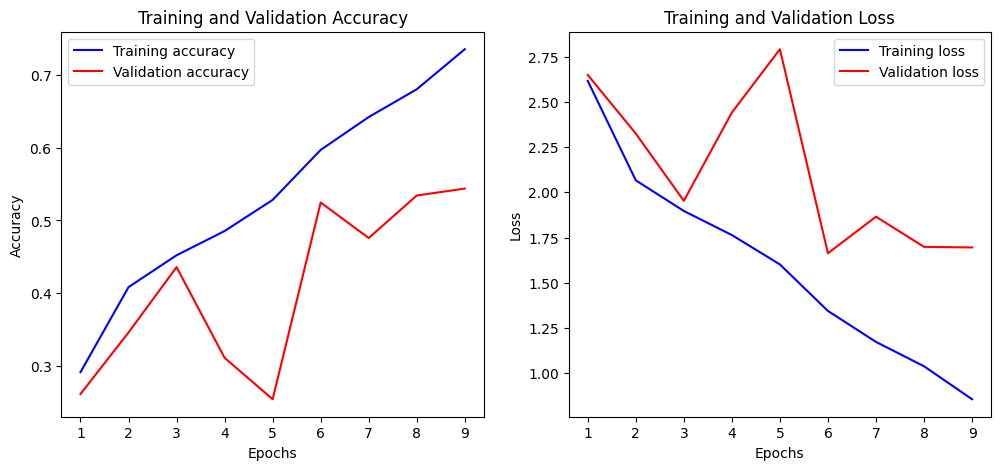
The training accuracy and loss show steady improvement, indicating that the model is learning the training data effectively.
However, the sharp fluctuations and overall lower performance in validation accuracy and loss suggest that the model struggles to generalize, which could be due to class imbalance causing instability in validation metrics or an overly high learning rate leading to erratic updates during training.
Classification Report
| Class | Precision | Recall | F1-score | Support |
|---|---|---|---|---|
| 0 | 0.6376 | 0.5376 | 0.5833 | 612 |
| 1 | 0.5000 | 0.4304 | 0.4626 | 539 |
| 2 | 0.7780 | 0.8919 | 0.8311 | 786 |
| 3 | 0.7500 | 0.1233 | 0.2118 | 146 |
| 4 | 0.2556 | 0.3788 | 0.3052 | 961 |
| 5 | 0.2366 | 0.0731 | 0.1117 | 424 |
| 6 | 0.4005 | 0.6817 | 0.5046 | 974 |
| 7 | 0.5300 | 0.3136 | 0.3941 | 169 |
| 8 | 0.3307 | 0.1677 | 0.2225 | 507 |
| 9 | 0.3784 | 0.2500 | 0.3011 | 672 |
| 10 | 0.4025 | 0.5173 | 0.4527 | 1013 |
| 11 | 0.7118 | 0.7432 | 0.7272 | 841 |
| 12 | 0.4742 | 0.3358 | 0.3932 | 137 |
| 13 | 0.3799 | 0.3780 | 0.3790 | 1029 |
| 14 | 0.4400 | 0.0647 | 0.1128 | 170 |
| 15 | 0.7053 | 0.7240 | 0.7145 | 942 |
| 16 | 0.5440 | 0.5578 | 0.5508 | 986 |
| 17 | 0.3926 | 0.3105 | 0.3467 | 306 |
| 18 | 0.5979 | 0.5298 | 0.5618 | 991 |
| 19 | 0.4183 | 0.1883 | 0.2597 | 462 |
| 20 | 0.5668 | 0.8119 | 0.6676 | 2047 |
| 21 | 0.5000 | 0.1695 | 0.2532 | 525 |
| 22 | 0.8636 | 0.8085 | 0.8352 | 517 |
| 23 | 0.9669 | 0.9259 | 0.9459 | 189 |
| 24 | 0.6551 | 0.5432 | 0.5939 | 521 |
| 25 | 0.4420 | 0.1709 | 0.2465 | 357 |
| 26 | 0.5000 | 0.2733 | 0.3534 | 161 |
| Metric | Value |
|---|---|
| Accuracy | 0.5247 |
| Macro avg Precision | 0.5318 |
| Macro avg Recall | 0.4408 |
| Macro avg F1-score | 0.4564 |
| Weighted avg Precision | 0.5242 |
| Weighted avg Recall | 0.5247 |
| Weighted avg F1-score | 0.5064 |
CNN Model 3 (Current version "best_model_miri.keras")
The third CNN architecture maintains the same overall structure as CNN Model 2 but introduces a change in learning rate schedule. It uses a cosine decay learning rate schedule instead of a constant learning rate, allowing for better optimization during training.
Training Configuration
Optimizer: Adam with cosine decay learning rate schedule Loss Function: Sparse Categorical Crossentropy Callbacks:
- Early Stopping (patience=3)
- ReduceLROnPlateau (factor=0.5, patience=2)
- ModelCheckpoint (save best model)
Training and Validation Accuracy Plot
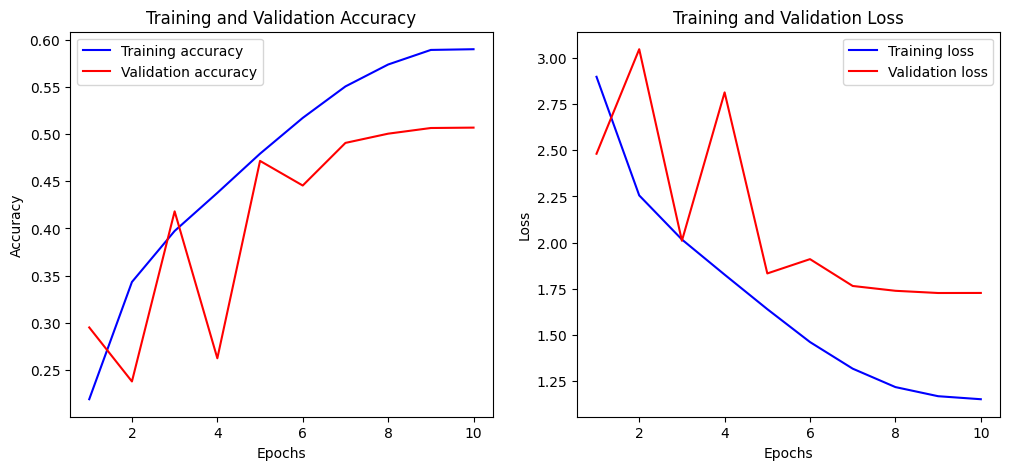
Compared to CNN2, CNN3 shows more stable improvements in both validation accuracy and loss, despite some early fluctuation.
The training metrics still improve steadily, but the validation metrics settle into a clearer upward trend, suggesting better generalization. This improvement is most likely due to the use of cosine decay on the learning rate, which gradually reduces the step size and helps the model converge more smoothly, avoiding the erratic behavior seen in CNN2.
Classification Report
| Class | Precision | Recall | F1-score | Support |
|---|---|---|---|---|
| 0 | 0.5451 | 0.6324 | 0.5855 | 612 |
| 1 | 0.4132 | 0.5213 | 0.4610 | 539 |
| 2 | 0.8566 | 0.8817 | 0.8690 | 786 |
| 3 | 0.1982 | 0.3082 | 0.2413 | 146 |
| 4 | 0.3111 | 0.2477 | 0.2758 | 961 |
| 5 | 0.1809 | 0.2099 | 0.1943 | 424 |
| 6 | 0.4955 | 0.5041 | 0.4997 | 974 |
| 7 | 0.3593 | 0.4911 | 0.4150 | 169 |
| 8 | 0.2281 | 0.2623 | 0.2440 | 507 |
| 9 | 0.2837 | 0.2723 | 0.2779 | 672 |
| 10 | 0.4934 | 0.3662 | 0.4204 | 1013 |
| 11 | 0.7612 | 0.7241 | 0.7422 | 841 |
| 12 | 0.2925 | 0.5401 | 0.3795 | 137 |
| 13 | 0.4351 | 0.3712 | 0.4006 | 1029 |
| 14 | 0.1483 | 0.2294 | 0.1801 | 170 |
| 15 | 0.7061 | 0.7219 | 0.7139 | 942 |
| 16 | 0.5567 | 0.5527 | 0.5547 | 986 |
| 17 | 0.3205 | 0.4608 | 0.3780 | 306 |
| 18 | 0.6578 | 0.4985 | 0.5672 | 991 |
| 19 | 0.2226 | 0.3117 | 0.2597 | 462 |
| 20 | 0.7539 | 0.5970 | 0.6663 | 2047 |
| 21 | 0.2828 | 0.3162 | 0.2986 | 525 |
| 22 | 0.7875 | 0.8743 | 0.8286 | 517 |
| 23 | 0.8960 | 0.9577 | 0.9258 | 189 |
| 24 | 0.5753 | 0.5643 | 0.5698 | 521 |
| 25 | 0.2537 | 0.2913 | 0.2712 | 357 |
| 26 | 0.3636 | 0.4969 | 0.4199 | 161 |
| Metric | Value |
|---|---|
| Accuracy | 0.5064 |
| Macro avg Precision | 0.4585 |
| Macro avg Recall | 0.4891 |
| Macro avg F1-score | 0.4682 |
| Weighted avg Precision | 0.5252 |
| Weighted avg Recall | 0.5064 |
| Weighted avg F1-score | 0.5115 |
Summary
Three CNN architectures were evaluated on the image classification task.
- CNN Model 1: Achieved 44.11% accuracy with a macro F1-score of 0.3647
- CNN Model 2: Achieved 52.47% accuracy with a macro F1-score of 0.4564
- CNN Model 3: Achieved 50.64% accuracy with a macro F1-score of 0.4682
CNN Model 2 shows the highest overall accuracy, while CNN Model 3 demonstrates more balanced performance across classes with better recall in many categories.
All models show strong performance on certain classes (particularly classes 2, 11, 15, 22, and 23) while struggling with others (classes 3, 5, 8, and 14). This suggests that some classes have more distinctive visual features than others, or potentially imbalanced representation in the training data.