Appearance
Contents
Convolutional Neural Networks (Multimodal)
This section documents the multimodal neural network approach, which combines both image and text data for product classification.
The multimodal models use the preprocessed datasets split into split_train and split_val directories. Images are stored in class-specific subfolders and are referenced in the tabular data by imageid and productid. The text data is constructed by concatenating the designation and description fields.
Preprocessing
- Image preprocessing: Images are loaded in grayscale and resized further to 128x128 pixels.
- Text preprocessing: The
designationanddescriptionfields are combined and tokenized using a KerasTextVectorizationlayer. - Label encoding: Product type codes (
prdtypecode) are label-encoded for use in the neural network.
CNN Model 1
The first multimodal architecture serves as a baseline for combining image and text information.
Image Branch
A convolutional neural network processes the image input. The architecture includes three convolutional blocks, each with batch normalization, max pooling, and dropout for regularization. The output is flattened and passed through a dense layer.
Text Branch
The text branch uses a Keras TextVectorization (using only the first 100 tokens of the text data for a quick first analysis) layer followed by an embedding layer and two bidirectional LSTM layers. The output is passed through a dense layer with batch normalization and dropout.
Fusion and Output
The outputs of the image and text branches are concatenated and passed through additional dense, batch normalization, and dropout layers before the final softmax output layer.
Training Configuration
Optimizer: Adam
Loss Function: Sparse Categorical Crossentropy
Batch Size: 64
Epochs: 10
Callbacks:
- EarlyStopping (patience=3)
- ReduceLROnPlateau (factor=0.5, patience=2)
- ModelCheckpoint (save best model)
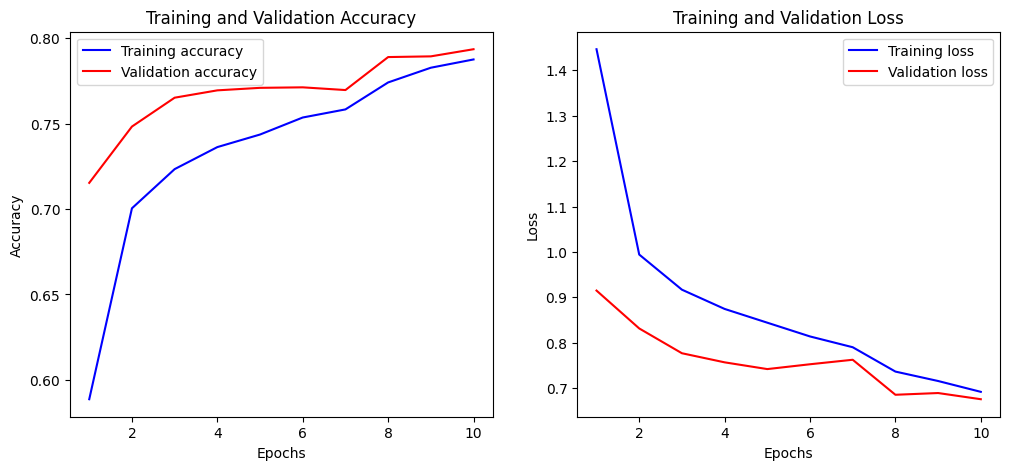
Training and Validation Accuracy Plot
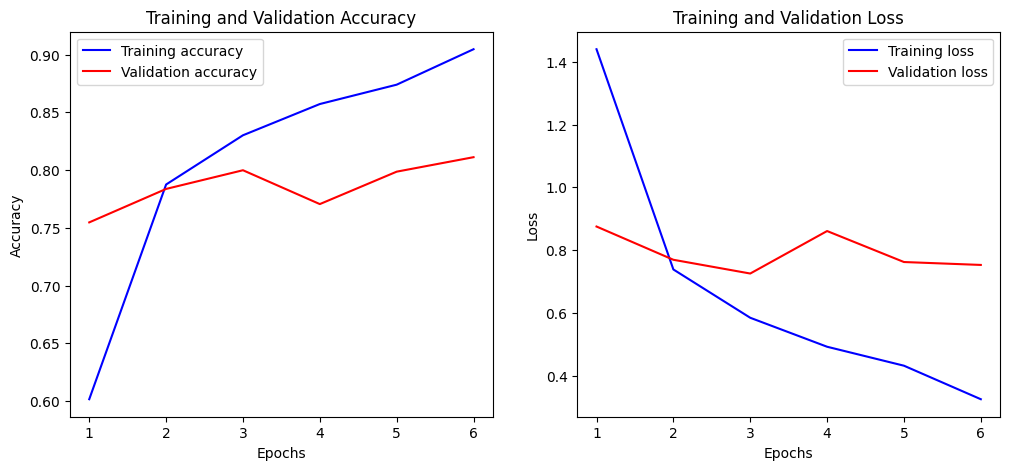
The training and validation accuracy curves show steady improvement until epoch 3, where validation accuracy peaks (validation loss peaks at epoch 4). Training accuracy improves further and training loss continues to fall during the following epochs (6, before training is stopped by callbacks), indicating some overfitting but reasonable accuracy of around 80%.
Classification Report
| Class | Precision | Recall | F1-score | Support |
|---|---|---|---|---|
| 0 | 0.5927 | 0.7418 | 0.6589 | 612 |
| 1 | 0.7438 | 0.6910 | 0.7164 | 521 |
| 2 | 0.7857 | 0.7703 | 0.7779 | 357 |
| 3 | 0.9272 | 0.8696 | 0.8974 | 161 |
| 4 | 0.6688 | 0.7718 | 0.7166 | 539 |
| 5 | 0.9215 | 0.9262 | 0.9239 | 786 |
| 6 | 0.5641 | 0.3014 | 0.3929 | 146 |
| 7 | 0.5743 | 0.6275 | 0.5997 | 961 |
| 8 | 0.4820 | 0.5047 | 0.4931 | 424 |
| 9 | 0.9408 | 0.8326 | 0.8834 | 974 |
| 10 | 0.8812 | 0.8343 | 0.8571 | 169 |
| 11 | 0.8106 | 0.7515 | 0.7799 | 507 |
| 12 | 0.7560 | 0.6548 | 0.7018 | 672 |
| 13 | 0.9025 | 0.7493 | 0.8188 | 1013 |
| 14 | 0.9181 | 0.8799 | 0.8986 | 841 |
| 15 | 0.8145 | 0.7372 | 0.7739 | 137 |
| 16 | 0.6796 | 0.8367 | 0.7500 | 1029 |
| 17 | 0.9154 | 0.7000 | 0.7933 | 170 |
| 18 | 0.9104 | 0.7335 | 0.8125 | 942 |
| 19 | 0.7303 | 0.8185 | 0.7719 | 986 |
| 20 | 0.7841 | 0.7712 | 0.7776 | 306 |
| 21 | 0.8807 | 0.9092 | 0.8947 | 991 |
| 22 | 0.7042 | 0.6905 | 0.6973 | 462 |
| 23 | 0.9686 | 0.9629 | 0.9657 | 2047 |
| 24 | 0.7519 | 0.7562 | 0.7540 | 525 |
| 25 | 0.8013 | 0.9439 | 0.8668 | 517 |
| 26 | 0.9691 | 0.9947 | 0.9817 | 189 |
| Metric | Value |
|---|---|
| Accuracy | 0.7999 |
| Macro avg Precision | 0.7918 |
| Macro avg Recall | 0.7689 |
| Macro avg F1-score | 0.7761 |
| Weighted avg Precision | 0.8085 |
| Weighted avg Recall | 0.7999 |
| Weighted avg F1-score | 0.8010 |
Summary CNN 1
CNN Model 1 demonstrates strong overall performance as a multimodal classifier, achieving a validation accuracy of 79.99% and a weighted F1-score of 0.8010.
The combination of a deep CNN for image features and bidirectional LSTM layers for text enables the model to capture both visual and sequential textual patterns effectively.
The training and validation curves indicate decent generalization with moderate overfitting.
- Stronger performance is observed in several classes (e.g., classes 3, 5, 9, 13, 14, 17, 18, 21, 23, 25, 26), with F1-scores above 0.85.
- Weaker performance is seen in classes with fewer samples or less distinctive features (e.g., class 6).
When rerunning the model with cropped images (background removed), accuracy did not significantly improve further.
CNN Model 2
The second multimodal architecture explores a different approach to text sequence modeling and learning rate scheduling.
Image Branch
The image branch is identical to CNN Model 1. It processes grayscale images resized to 128x128 pixels using a series of convolutional blocks (Conv2D, BatchNormalization, MaxPooling2D, Dropout), followed by flattening and a dense layer.
Text Branch
The text branch differs from Model 1 in two key ways:
- Token Length: The
TextVectorizationlayer uses the first 300 tokens of the concatenateddesignationanddescriptionfields (instead of 100). - Sequence Model: Instead of LSTM layers, the branch uses two 1D convolutional layers (
Conv1D) to extract local n-gram features from the embedded text sequence. This is followed by global max pooling and dense layers with batch normalization and dropout for regularization.
Fusion and Output
See model 1.
Training Configuration
Optimizer: Adam
Loss Function: Sparse Categorical Crossentropy
Batch Size: 64
Epochs: 10
Callbacks:
- EarlyStopping (patience=3)
- CosineDecay learning rate scheduler (replaces ReduceLROnPlateau)
- ModelCheckpoint (save best model)
Training and Validation Accuracy Plot
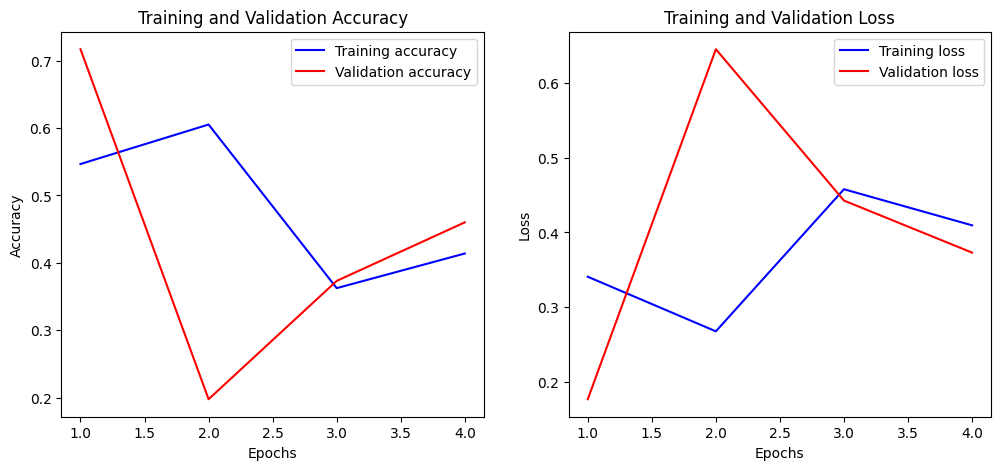
While training accuracy improves for the first two epochs, then falls and improves again at a lower level of only around 40% up to epoch 4, validation accuracy seems volatile and falls significantly during the first two epochs to below 20%, then slowly but steadily increasing until epcoh 4 when training is stopped by callbacks.
The adjustmeants to the learning rate may have lead to this extreme volatility in validation accuracy, which remains lower at around 71% compared to almost 80% for model 1.
Classification Report
| Class | Precision | Recall | F1-score | Support |
|---|---|---|---|---|
| 0 | 0.3903 | 0.3170 | 0.3499 | 612 |
| 1 | 0.6631 | 0.4760 | 0.5542 | 521 |
| 2 | 0.3909 | 0.8683 | 0.5391 | 357 |
| 3 | 0.9672 | 0.7329 | 0.8339 | 161 |
| 4 | 0.6345 | 0.6827 | 0.6577 | 539 |
| 5 | 0.9656 | 0.7494 | 0.8438 | 786 |
| 6 | 0.4444 | 0.0274 | 0.0516 | 146 |
| 7 | 0.4961 | 0.7253 | 0.5892 | 961 |
| 8 | 0.4977 | 0.2571 | 0.3390 | 424 |
| 9 | 0.9089 | 0.8090 | 0.8561 | 974 |
| 10 | 0.9015 | 0.7041 | 0.7907 | 169 |
| 11 | 0.8571 | 0.6982 | 0.7696 | 507 |
| 12 | 0.5655 | 0.6875 | 0.6206 | 672 |
| 13 | 0.8743 | 0.7206 | 0.7900 | 1013 |
| 14 | 0.9372 | 0.7812 | 0.8521 | 841 |
| 15 | 0.5200 | 0.1898 | 0.2781 | 137 |
| 16 | 0.7383 | 0.7648 | 0.7513 | 1029 |
| 17 | 0.6846 | 0.5235 | 0.5933 | 170 |
| 18 | 0.8753 | 0.7006 | 0.7783 | 942 |
| 19 | 0.8719 | 0.6765 | 0.7619 | 986 |
| 20 | 0.8394 | 0.3758 | 0.5192 | 306 |
| 21 | 0.8960 | 0.8345 | 0.8642 | 991 |
| 22 | 0.7333 | 0.5238 | 0.6111 | 462 |
| 23 | 0.8978 | 0.9658 | 0.9306 | 2047 |
| 24 | 0.3760 | 0.7943 | 0.5104 | 525 |
| 25 | 0.4540 | 0.8395 | 0.5893 | 517 |
| 26 | 0.9894 | 0.9841 | 0.9867 | 189 |
| Metric | Value |
|---|---|
| Accuracy | 0.7168 |
| Macro avg Precision | 0.7174 |
| Macro avg Recall | 0.6448 |
| Macro avg F1-score | 0.6523 |
| Weighted avg Precision | 0.7555 |
| Weighted avg Recall | 0.7168 |
| Weighted avg F1-score | 0.7192 |
Summary CNN 2
CNN Model 2 achieves a validation accuracy of 71.68% and a weighted F1-score of 0.7192.
This model uses the same CNN image branch as model 1, but replaces the LSTM-based text branch with two Conv1D layers and increases the text sequence length to 300 tokens. A cosine decay learning rate schedule is also introduced.
The training and validation curves show significant volatility, with validation accuracy dropping sharply in the early epochs before recovering, and overall accuracy remaining lower than Model 1.
- Stronger performance is still observed in several classes (e.g., classes 3, 5, 9, 13, 14, 18, 21, 23, 26), but with generally lower F1-scores compared to model 1.
- Weaker performance is especially pronounced in classes with fewer samples or less distinctive features (e.g., class 6, class 15), and the model struggles more with class imbalance.
CNN Model 3
The third multimodal architecture builds on the strengths of previous models, aiming for improved performance and stability.
Image Branch
The image branch remains identical to previous models, processing grayscale images resized to 128x128 pixels through a series of convolutional blocks (Conv2D, BatchNormalization, MaxPooling2D, Dropout), followed by flattening and a dense layer.
Text Branch
The text branch returns to a bidirectional LSTM-based approach, but with moderate enhancements:
- Token Length: The
TextVectorizationlayer uses the first 150 tokens of the concatenateddesignationanddescriptionfields. - Vocabulary Size: The vocabulary is increased to 12,000 (
max_tokens=12000), allowing the model to capture a broader range of unique words and product-specific terminology. - Sequence Model: Two bidirectional LSTM layers are used, each with 80 units, providing a balance between model capacity and training speed. Dropout is applied for regularization, and the embedding dimension is set to 80 for richer representations.
Fusion and Output
See model 1.
Training Configuration
Optimizer: Adam
Loss Function: Sparse Categorical Crossentropy
Batch Size: 64
Epochs: 10
Callbacks:
- EarlyStopping (patience=3)
- ReduceLROnPlateau (factor=0.5, patience=2)
- ModelCheckpoint (save best model)
Training and Validation Accuracy Plot
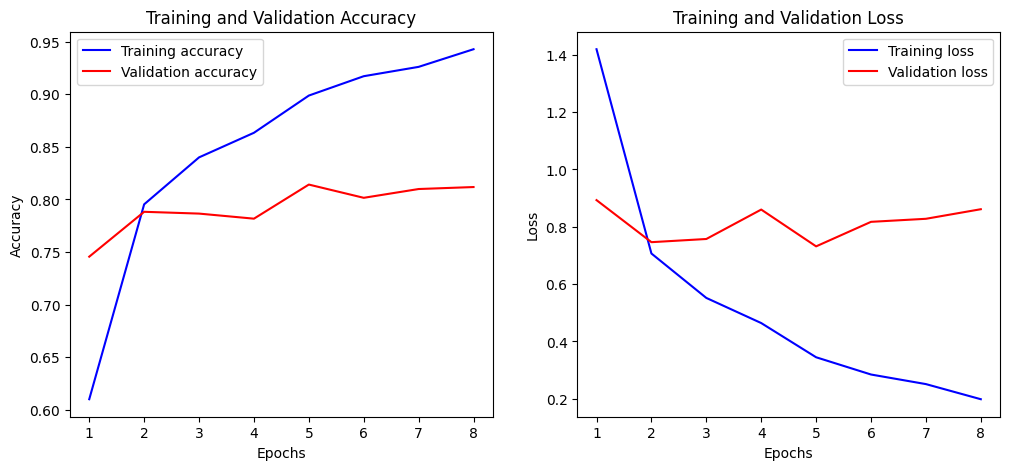
There is slow but steady improvement in the validation accuracy up to epoch 5 where it drops and then plateaus for the remaining training epochs. The loss function also shows the best results in epoch 5.
The training accuracy continues to improve, showing some signs of overfitting, however both accuracy values reach over 80% eventually.
Classification Report
| Label | Precision | Recall | F1-score | Support |
|---|---|---|---|---|
| 2905 | 0.9741 | 0.9947 | 0.9843 | 189 |
| 2583 | 0.9345 | 0.9834 | 0.9583 | 2047 |
| 2522 | 0.9346 | 0.8799 | 0.9064 | 991 |
| 1920 | 0.9172 | 0.8823 | 0.8994 | 841 |
| 1160 | 0.8400 | 0.9555 | 0.8940 | 786 |
| 1300 | 0.9119 | 0.8717 | 0.8913 | 974 |
| 2280 | 0.8599 | 0.8408 | 0.8502 | 942 |
| 1301 | 0.8820 | 0.8402 | 0.8606 | 169 |
| 1560 | 0.8664 | 0.7749 | 0.8181 | 1013 |
| 2060 | 0.6969 | 0.8134 | 0.7507 | 1029 |
| 2403 | 0.7676 | 0.8073 | 0.7870 | 986 |
| 60 | 0.9773 | 0.8012 | 0.8805 | 161 |
| 2705 | 0.9333 | 0.7041 | 0.8026 | 517 |
| 1140 | 0.5537 | 0.8219 | 0.6617 | 539 |
| 2462 | 0.7240 | 0.7974 | 0.7589 | 306 |
| 1302 | 0.7895 | 0.7396 | 0.7637 | 507 |
| 2585 | 0.7743 | 0.6533 | 0.7087 | 525 |
| 1320 | 0.7102 | 0.7039 | 0.7070 | 672 |
| 50 | 0.7091 | 0.7171 | 0.7131 | 357 |
| 1280 | 0.6062 | 0.6472 | 0.6261 | 961 |
| 2582 | 0.7973 | 0.6299 | 0.7037 | 462 |
| 10 | 0.4903 | 0.7859 | 0.6039 | 612 |
| 40 | 0.8305 | 0.5547 | 0.6651 | 521 |
| 2220 | 0.8824 | 0.5294 | 0.6618 | 170 |
| 1940 | 0.7680 | 0.7007 | 0.7328 | 137 |
| 1281 | 0.6849 | 0.3538 | 0.4666 | 424 |
| 1180 | 0.6622 | 0.3356 | 0.4455 | 146 |
| Metric | Value |
|---|---|
| Accuracy | 0.8141 |
| Macro avg Precision | 0.8064 |
| Macro avg Recall | 0.7891 |
| Macro avg F1-score | 0.7955 |
| Weighted avg Precision | 0.8168 |
| Weighted avg Recall | 0.8141 |
| Weighted avg F1-score | 0.8136 |
Summary CNN 3
CNN Model 3 achieves a validation accuracy of 81.41% and a weighted F1-score of 0.8136.
This model combines a robust CNN image branch with an enhanced bidirectional LSTM text branch (two layers, 80 units each, 150 tokens), striking a balance between model capacity and efficiency. The training and validation curves show stable improvement despite overfitting.
- Stronger performance is observed in many classes (e.g., classes 3, 5, 9, 10, 13, 14, 15, 17, 18, 21, 23, 25, 26), with F1-scores above 0.85.
- Weaker performance is still present in some underrepresented or less distinctive classes (e.g., class 6, class 8), but overall class balance and generalization are improved compared to previous models.
When rerunning the model with cropped images (background removed), accuracy did not significantly improve further.
Camembert Model
This section documents the multimodal neural network approach using pretrained Camembert embeddings combined with a CNN architecture for product classification.
The model utilizes frozen Camembert [CLS] embeddings extracted from concatenated text fields (designation + description). These embeddings serve as fixed-length feature vectors input to convolutional layers.
Camembert Model Embeddings
The text data is tokenized using the CamembertTokenizer and fed into the frozen TFCamembertModel. The [CLS] token embedding from the last hidden layer is extracted, representing the entire sequence's semantic meaning. Embeddings are computed in batches, saved, and used as input features for the CNN model.
Image Branch
See other models.
Text Branch
The model's text branch takes the precomputed Camembert [CLS] embeddings as input. These embeddings are passed through several 1D convolutional layers with batch normalization and dropout. This enables capturing local semantic n-gram features within the embedding space. A global max pooling layer follows to aggregate features.
Fusion and Output
See other models.
Training Configuration
Optimizer: Adam
Loss Function: Sparse Categorical Crossentropy
Batch Size: 64
Epochs: 10
Callbacks:
- EarlyStopping (patience=3)
- ReduceLROnPlateau (factor=0.5, patience=2)
- ModelCheckpoint (save best model)
Training and Validation Accuracy Plot
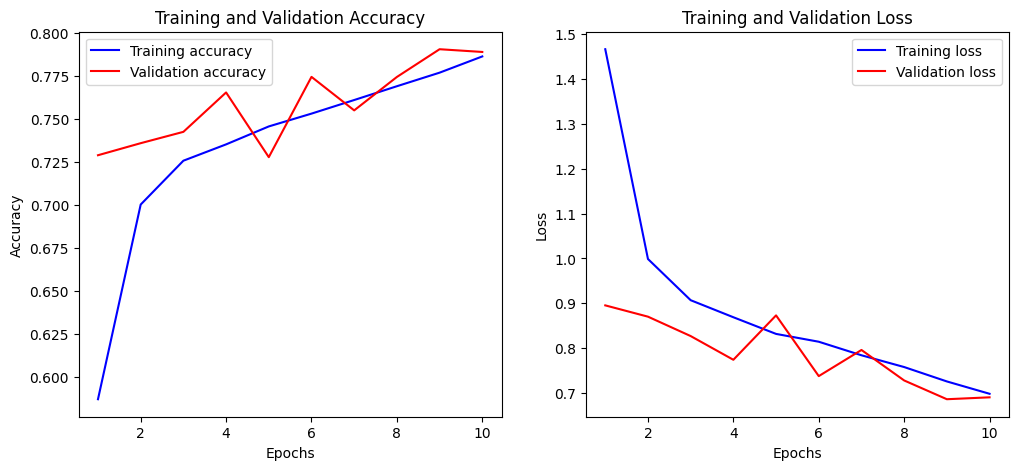
Both training and validation accuracy steadily improve throughout the epochs, with validation accuracy closely tracking training accuracy and ending at roughly 79%.
Minor fluctuations in validation accuracy and loss around epochs 4–7 reflect normal variance rather than overfitting, as the validation metrics mirror the training curves and the gap between losses narrows over time. Overall, the model demonstrates stable learning and good generalization, with no significant signs of overfitting or underfitting.
Classification Report
| Class | Precision | Recall | F1-score | Support |
|---|---|---|---|---|
| 0 | 0.6303 | 0.7827 | 0.6983 | 612 |
| 1 | 0.7179 | 0.6987 | 0.7082 | 521 |
| 2 | 0.7562 | 0.6779 | 0.7149 | 357 |
| 3 | 0.9388 | 0.8571 | 0.8961 | 161 |
| 4 | 0.6799 | 0.7959 | 0.7333 | 539 |
| 5 | 0.9273 | 0.9567 | 0.9418 | 786 |
| 6 | 0.6038 | 0.2192 | 0.3216 | 146 |
| 7 | 0.5646 | 0.5047 | 0.5330 | 961 |
| 8 | 0.5394 | 0.5165 | 0.5277 | 424 |
| 9 | 0.7885 | 0.9189 | 0.8487 | 974 |
| 10 | 0.9213 | 0.6923 | 0.7905 | 169 |
| 11 | 0.7192 | 0.6213 | 0.6667 | 507 |
| 12 | 0.7785 | 0.6801 | 0.7260 | 672 |
| 13 | 0.7553 | 0.7345 | 0.7447 | 1013 |
| 14 | 0.8960 | 0.8811 | 0.8885 | 841 |
| 15 | 0.8800 | 0.9635 | 0.9199 | 137 |
| 16 | 0.6948 | 0.7677 | 0.7295 | 1029 |
| 17 | 0.8364 | 0.8118 | 0.8239 | 170 |
| 18 | 0.8719 | 0.8312 | 0.8511 | 942 |
| 19 | 0.8052 | 0.7921 | 0.7986 | 986 |
| 20 | 0.7315 | 0.7745 | 0.7524 | 306 |
| 21 | 0.8560 | 0.8698 | 0.8629 | 991 |
| 22 | 0.6815 | 0.6299 | 0.6547 | 462 |
| 23 | 0.9367 | 0.9609 | 0.9486 | 2047 |
| 24 | 0.7505 | 0.6933 | 0.7208 | 525 |
| 25 | 0.9159 | 0.9478 | 0.9316 | 517 |
| 26 | 0.9637 | 0.9841 | 0.9738 | 189 |
| Metric | Value |
|---|---|
| Accuracy | 0.7907 |
| Macro avg Precision | 0.7830 |
| Macro avg Recall | 0.7616 |
| Macro avg F1-score | 0.7669 |
| Weighted avg Precision | 0.7897 |
| Weighted avg Recall | 0.7907 |
| Weighted avg F1-score | 0.7879 |
Summary Camembert Model
The CNN Camembert model leverages powerful contextual embeddings from a pretrained Camembert language model, using frozen [CLS] embeddings as fixed feature vectors.
Passing these embeddings through convolutional layers allows capturing local semantic patterns, resulting in a validation accuracy of 79.07% and weighted F1-score of 0.7879.
Despite strong performance, the model underperforms compared to enhanced LSTM models due to:
- Lack of fine-tuning on Camembert embeddings, limiting task adaptation.
- CNN over embeddings captures local patterns but misses longer-range dependencies modeled by LSTMs.
- No image data integration, unlike some multimodal architectures.
- Model 3's improved text branch and training regimen lead to better generalization and class balance.
Nevertheless, the Camembert model provides a strong baseline utilizing pretrained language knowledge effectively in a CNN framework.
Fine-Tuned Camembert Multimodal Model
This section documents the multimodal neural network approach using a jointly fine-tuned Camembert model combined with a CNN architecture for product classification. Unlike previous models that use frozen Camembert embeddings, this architecture enables end-to-end training, allowing Camembert's language representations to adapt to the specific classification task.
Camembert Model Embeddings
Text data is dynamically tokenized using the CamembertTokenizer and fed into a custom Keras layer wrapping the PyTorch CamembertModel. The [CLS] token embedding from the last hidden layer is extracted for each sample, representing the semantic meaning of the concatenated designation and description fields. Crucially, Camembert's weights are updated during training, enabling the model to learn task-specific features.
Image Branch
The image branch remains unchanged from previous architectures. Grayscale product images are resized and normalized, then passed through a deep stack of convolutional layers with batch normalization and dropout. These layers extract high-level visual features, which are further processed by dense layers.
Text Branch
The text branch receives [CLS] embeddings from the fine-tuned Camembert model. These embeddings are processed through dense layers with batch normalization and dropout, enhancing feature extraction and regularization. This enables the model to capture both global and local semantic patterns relevant to product classification.
Fusion and Output
Text and image features are concatenated and passed through additional dense layers with dropout and batch normalization. The final output layer uses softmax activation to predict product classes.
Training Configuration
Optimizer: Adam
Loss Function: Sparse Categorical Crossentropy
Batch Size: 64
Epochs: 10
Callbacks:
- EarlyStopping (patience=3)
- ReduceLROnPlateau (factor=0.5, patience=2)
- ModelCheckpoint (save best model)
Training and Validation Accuracy Plot
Both training and validation accuracy show steady improvement across epochs, with validation accuracy closely tracking training accuracy and reaching approximately 79.4% by the final epoch. Minor fluctuations in validation metrics are observed but the overall trends indicate stable learning and good generalization. The narrowing gap between training and validation loss further suggests the model is not overfitting.
Classification Report
| Class | Precision | Recall | F1-score | Support |
|---|---|---|---|---|
| 0 | 0.6865 | 0.7908 | 0.7350 | 612 |
| 1 | 0.7603 | 0.6756 | 0.7154 | 521 |
| 2 | 0.7437 | 0.7395 | 0.7416 | 357 |
| 3 | 0.9262 | 0.8571 | 0.8903 | 161 |
| 4 | 0.6672 | 0.8145 | 0.7335 | 539 |
| 5 | 0.9470 | 0.9555 | 0.9512 | 786 |
| 6 | 0.6486 | 0.3288 | 0.4364 | 146 |
| 7 | 0.5998 | 0.5068 | 0.5494 | 961 |
| 8 | 0.5546 | 0.4788 | 0.5139 | 424 |
| 9 | 0.8154 | 0.9117 | 0.8609 | 974 |
| 10 | 0.9197 | 0.7456 | 0.8235 | 169 |
| 11 | 0.6823 | 0.6607 | 0.6713 | 507 |
| 12 | 0.8153 | 0.6503 | 0.7235 | 672 |
| 13 | 0.7526 | 0.7177 | 0.7347 | 1013 |
| 14 | 0.8848 | 0.8859 | 0.8853 | 841 |
| 15 | 0.8904 | 0.9489 | 0.9187 | 137 |
| 16 | 0.6645 | 0.7911 | 0.7223 | 1029 |
| 17 | 0.8471 | 0.7824 | 0.8135 | 170 |
| 18 | 0.8306 | 0.8747 | 0.8521 | 942 |
| 19 | 0.7988 | 0.7809 | 0.7897 | 986 |
| 20 | 0.7580 | 0.7778 | 0.7677 | 306 |
| 21 | 0.8686 | 0.8668 | 0.8677 | 991 |
| 22 | 0.6165 | 0.6645 | 0.6396 | 462 |
| 23 | 0.9369 | 0.9580 | 0.9473 | 2047 |
| 24 | 0.7533 | 0.6571 | 0.7019 | 525 |
| 25 | 0.9419 | 0.9400 | 0.9409 | 517 |
| 26 | 0.9541 | 0.9894 | 0.9714 | 189 |
| Metric | Value |
|---|---|
| Accuracy | 0.7936 |
| Macro avg Precision | 0.7876 |
| Macro avg Recall | 0.7685 |
| Macro avg F1-score | 0.7740 |
| Weighted avg Precision | 0.7930 |
| Weighted avg Recall | 0.7936 |
| Weighted avg F1-score | 0.7909 |
Summary Camembert Model
By fine-tuning Camembert within the multimodal architecture, the model adapts powerful language representations to the product classification task, resulting in improved semantic understanding and class discrimination. The fusion of trainable Camembert embeddings and deep CNN image features yields a validation accuracy of 79.36% and a weighted F1-score of 0.7909, slightly outperforming the frozen Camembert baseline but still not reaching CNN model 3 (Enhanced LSTM).
The model remains robust, with no significant signs of overfitting, and provides a strong foundation for further multimodal enhancements.
Model Comparison
CNN Model 1 (LSTM)
- Validation Accuracy: 79.99%
- Weighted F1-score: 0.8010
CNN Model 2 (Conv1D)
- Validation Accuracy: 71.68%
- Weighted F1-score: 0.7192
CNN Model 3 (Enhanced LSTM)
- Validation Accuracy: 81.41%
- Weighted F1-score: 0.8136
CNN Camembert Model
- Validation Accuracy: 79.07%
- Weighted F1-score: 0.7879
Fine-Tuned Camembert Multimodal Model
- Validation Accuracy: 79.36%
- Weighted F1-score: 0.7909
Model 3 achieves the best overall performance, surpassing both previous models in accuracy and F1-score. The enhanced LSTM-based text branch and stable training configuration lead to improved generalization and class balance, making Model 3 the preferred choice for this multimodal product classification task.