Appearance
Contents
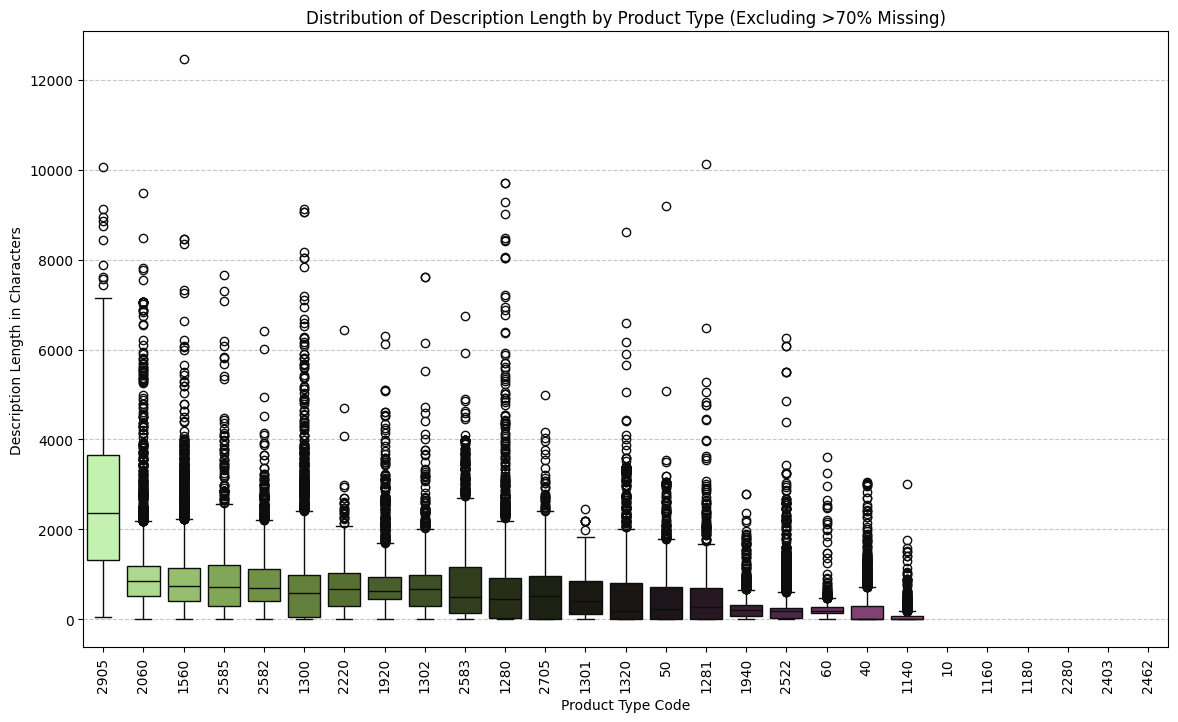
Barplot of descrption lengths by product type
Description and analysis
The boxplot shows the correlation of the length of the 'description' variable to the product type.
| Product Type Code | Average Description Length |
|---|---|
| 2905 | 2652 |
| 2060 | 1013 |
| 1560 | 922 |
| 2585 | 886 |
| 2582 | 859 |
| 1300 | 766 |
| 2220 | 750 |
| 1920 | 739 |
| 1302 | 729 |
| 2583 | 719 |
| 1280 | 630 |
| 2705 | 593 |
| 1301 | 508 |
| 1320 | 500 |
| 50 | 475 |
| 1281 | 470 |
| 1940 | 318 |
| 2522 | 261 |
| 60 | 252 |
| 40 | 192 |
| 1140 | 60 |
| 10 | more than 70% NaN |
| 1160 | more than 70% NaN |
| 1180 | more than 70% NaN |
| 2280 | more than 70% NaN |
| 2403 | more than 70% NaN |
| 2462 | more than 70% NaN |
Validation
A chi-square test reveals a significant deviation from a uniform distribution in description length, indicating that the lenghts of the descriptions are indeed not evenly distributed across all product types.
Chi-square statistic: 8637417.13
p-value: 0.0
INFO
A p-value of 0 may also be due to the very large sample size of X_train, so that the deviation is not as strong as implied by the values of the chi-square test.
Business relevance
Varying description lengths in Rakuten e-commerce can impact customer decision-making and SEO performance. Longer descriptions enhance product understanding and visibility by incorporating relevant keywords, while shorter descriptions may lack detail, affecting customer satisfaction.
Optimizing description lengths ensures comprehensive product information, improving the shopping experience and driving higher conversion rates. Leveraging detailed descriptions in marketing strategies can further enhance engagement and customer loyalty.